Ultimately I will move to a generic smart phone for this project. I'm trying to read 4 analog inputs from my arduino with a fixed 1kHz sampling frequency. I managed to set it to read at 1kHz as you can see from this link. The issue is that after running several times, I kept testing the frequency by logging the time vector (produced by arduino to the serial terminal) into Excel and calculating the frequency using the equation: f=1/(t2-t1)
I did this to the entire column and I noticed that I got a changing frequency. The difference is very big as it ranges from 780 to 1kHz. I need a fixed sampling rate because we will be applying some digital signal processing on the obtained results which obviously requires a sampling frequency. My code to send the data is the following:
#define INTERVAL_LENGTH_US 1000UL

unsigned long previousMicros;
#define FASTADC 1
int recValue;
// defines for setting and clearing register bits
#ifndef cbi
#define cbi(sfr, bit) (_SFR_BYTE(sfr) &= ~_BV(bit))
#endif
#ifndef sbi
#define sbi(sfr, bit) (_SFR_BYTE(sfr) |= _BV(bit))
#endif
double t = 0;


void setup() {
  int start ;
  int i ;

#if FASTADC
  // set prescale to 16
  sbi(ADCSRA, ADPS2) ;
  cbi(ADCSRA, ADPS1) ;
  cbi(ADCSRA, ADPS0) ;
#endif

  Serial.begin(115200) ;
}


void loop()
{
  unsigned long currentMicros = micros();

  if ((currentMicros - previousMicros) >= INTERVAL_LENGTH_US)
  {
    previousMicros += INTERVAL_LENGTH_US;

    int val_a0 = analogRead(A0);
    int val_a1 = analogRead(A1);
    int val_a2 = analogRead(A2);
    int val_a3 = analogRead(A3);

    Serial.print(((double)currentMicros) / 1000000UL, 5 ); // 1 is the number of decimals to print
    Serial.print('\t');

    Serial.print(val_a0);
    Serial.print(',');

    Serial.print(val_a1);
    Serial.print(',');

    Serial.print(val_a2);
    Serial.print(',');

    Serial.println(val_a3);


  }
}
Ps. I'm using Arduino Leonardo, What's the right way to achieve this?
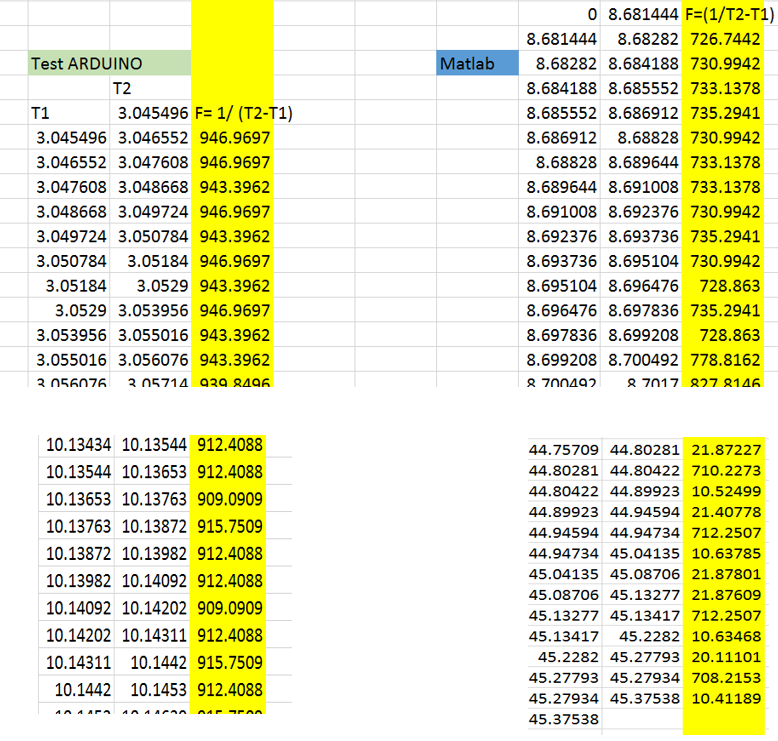
EDIT: Thank you all for responding, As you wanted to see my data, here is a screenshot of the results after I applied Jwpat7's suggestion:

The yello shaded column is the frequency calculated, the first and 2nd columns represent T1 and T1 (T2 is just T1 shifted upward for easier calculation). You may notice the Matlab section, this is because I'm trying to plot the data in Matlab and use it to do the digital signal processing after transmission. The plotting will be real time (I'll the data in txt files for later processing). the bottom potion of the figure shows the frequency after a while....as you can see it's decreasing!
Thanks


